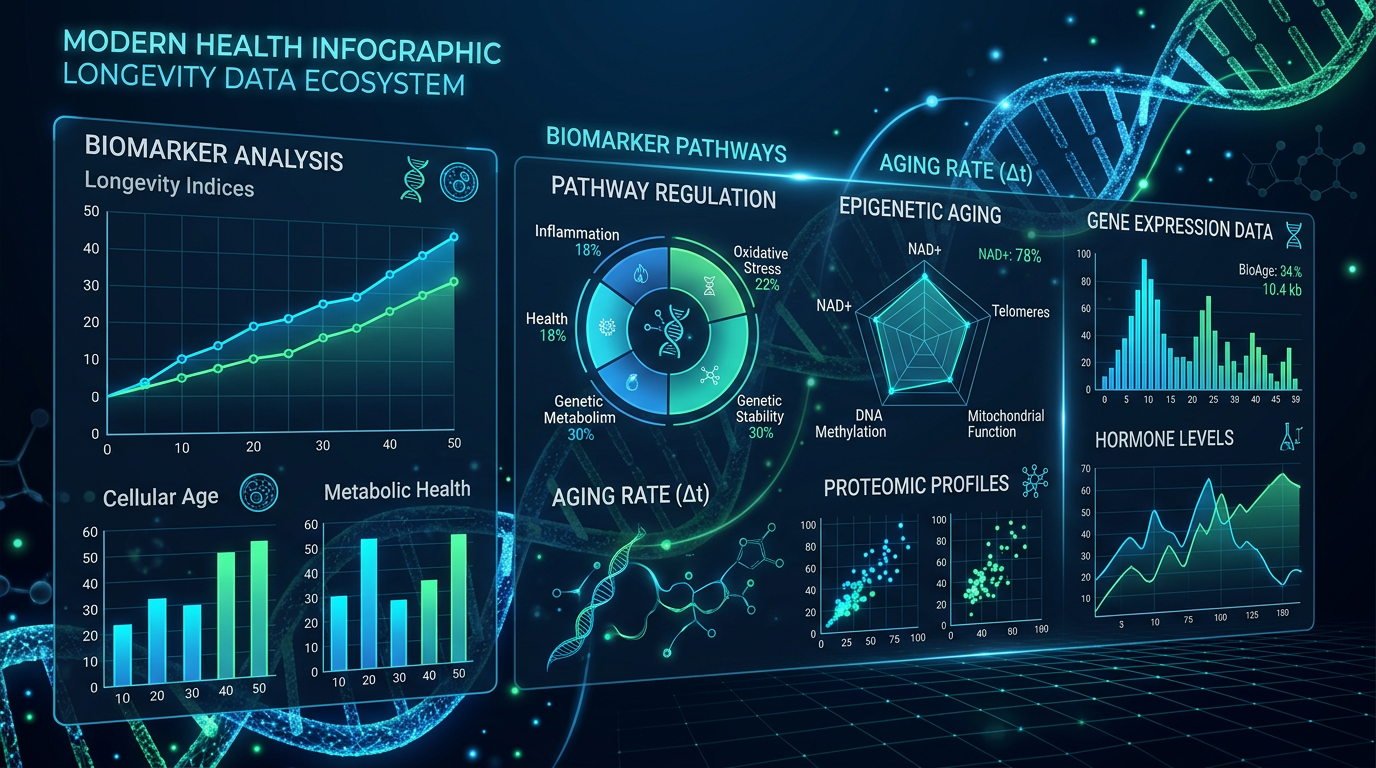
Understanding Your Blood Work: Key Biomarkers for Longevity
Key Takeaway
Your annual physical probably includes a basic metabolic panel and a standard lipid test. Your doctor glances at the results, says "everything looks normal," and sends you on your way. Here's the uncomfortable truth: those standard panels are designed to detect disease, not optimize health. By the t
Affiliate Disclosure: BetterVitals may earn a commission from purchases made through links in this article, at no additional cost to you. This supports our independent research and analysis. We only recommend products we believe in after thorough evaluation.
Medical Disclaimer
This article is for educational purposes only and is not a substitute for professional medical advice, diagnosis, or treatment. Always consult your healthcare provider before making health decisions.
Understanding Your Blood Work: Key Biomarkers for Longevity
Your annual physical probably includes a basic metabolic panel and a standard lipid test. Your doctor glances at the results, says "everything looks normal," and sends you on your way. Here's the uncomfortable truth: those standard panels are designed to detect disease, not optimize health. By the time a marker falls outside the "normal" range, dysfunction has often been brewing for years.
Longevity medicine takes a fundamentally different approach. Instead of asking "are you sick?", it asks "how far are you from optimal?" The difference is enormous. A fasting glucose of 98 mg/dL is technically normal. But it puts you at the upper edge of a range associated with increased cardiovascular risk, cognitive decline, and accelerated aging. A longevity-focused physician would flag it immediately.
This guide covers the biomarkers that actually matter for long-term health, the optimal ranges that longevity researchers target (not just standard reference ranges), and how to interpret your results in context. If you're ready to start testing, our best at-home blood test guide compares the top services.
Why Standard Blood Work Misses Longevity Markers
Standard blood panels were designed for a specific purpose: screening for disease. The reference ranges printed on your lab report represent the middle 95% of the tested population. If your result falls within that range, you're "normal."
The problem? The population used to set those ranges includes people with obesity, metabolic syndrome, chronic inflammation, and early-stage disease. "Normal" doesn't mean "healthy"—it means "statistically average in a largely unhealthy population."
Here's what standard panels typically miss:
- Fasting insulin. Your doctor probably tests glucose but not insulin. Insulin rises years before glucose does in the progression toward type 2 diabetes. By the time glucose is elevated, you've already lost significant metabolic flexibility.
- ApoB. Standard lipid panels report LDL-C (LDL cholesterol), but ApoB—the number of atherogenic lipoprotein particles—is a far better predictor of cardiovascular risk. Two people can have identical LDL-C levels but vastly different ApoB counts and cardiovascular risk.
- Lp(a). This genetically determined lipoprotein is an independent cardiovascular risk factor, yet most people have never had it tested. You only need to check it once, but that one test could change your entire risk management strategy.
- hsCRP. Standard CRP tests measure acute inflammation (like an infection). High-sensitivity CRP (hsCRP) detects the chronic, low-grade inflammation that drives aging, heart disease, and neurodegeneration.
- Omega-3 Index. This measures the percentage of EPA and DHA in your red blood cell membranes. An index below 4% doubles your risk of sudden cardiac death compared to an index above 8%. Almost no standard panel includes it.
The takeaway: if you're relying solely on what your doctor orders, you're flying partially blind.
Key Biomarkers by Category
Metabolic Health
Metabolic biomarkers tell you how well your body processes fuel. They're the earliest warning system for insulin resistance, type 2 diabetes, and metabolic syndrome—conditions that accelerate aging across every organ system.
Fasting Glucose
- What it measures: Blood sugar after 12+ hours without food.
- Standard range: 70-99 mg/dL.
- Optimal range: 72-85 mg/dL.
- Why it matters: Fasting glucose above 90 mg/dL, while "normal," is associated with increased cardiovascular mortality in large epidemiological studies. The Whitehall II study found a linear relationship between fasting glucose and dementia risk, starting well below the diabetic threshold.
- Context: A single reading is a snapshot. If you want real-time glucose data, a CGM for non-diabetics provides continuous insight into your glucose patterns throughout the day.
HbA1c (Glycated Hemoglobin)
- What it measures: Your average blood sugar over the past 90 days.
- Standard range: Below 5.7%.
- Optimal range: 4.8-5.4%.
- Why it matters: HbA1c is less susceptible to day-to-day variation than fasting glucose. A level of 5.5-5.6% is technically "normal" but already indicates your average glucose is higher than ideal. Research published in The Lancet showed a continuous relationship between HbA1c and cardiovascular events, with no safe threshold.
Fasting Insulin
- What it measures: Baseline insulin levels in a fasted state.
- Standard range: 2.6-24.9 µIU/mL (this range is absurdly wide).
- Optimal range: 2-6 µIU/mL.
- Why it matters: This is arguably the most underutilized biomarker in preventive medicine. Insulin resistance—where your cells require more and more insulin to process glucose—is the root driver of metabolic syndrome, type 2 diabetes, PCOS, and possibly Alzheimer's disease. Fasting insulin rises years before glucose does, making it the earliest metabolic warning signal.
- The standard range tells you almost nothing useful. A fasting insulin of 20 µIU/mL is "normal" but indicates significant insulin resistance.
HOMA-IR (Homeostatic Model Assessment of Insulin Resistance)
- What it measures: A calculated ratio of fasting glucose and fasting insulin.
- Optimal range: Below 1.0.
- Why it matters: HOMA-IR is the gold standard for estimating insulin resistance without a glucose tolerance test. It combines two data points into a single, actionable number. A HOMA-IR above 2.0 strongly suggests insulin resistance, even if both glucose and insulin are individually within "normal" ranges.
Lipids & Cardiovascular Risk
The standard lipid panel (total cholesterol, LDL-C, HDL-C, triglycerides) has been the foundation of cardiovascular risk assessment for decades. It's not wrong—but it's incomplete. Modern longevity medicine focuses on particle-level lipid analysis for a more accurate picture.
ApoB (Apolipoprotein B)
- What it measures: The number of atherogenic (artery-clogging) lipoprotein particles in your blood. Each LDL, VLDL, and Lp(a) particle carries exactly one ApoB molecule, making it a direct count of "bad" particles.
- Optimal range: Below 80 mg/dL (some longevity physicians target below 60 mg/dL).
- Why it matters: ApoB is the single best blood marker for predicting cardiovascular disease. A 2020 meta-analysis in JAMA Cardiology found that ApoB was superior to LDL-C for predicting cardiovascular events. Two people can have the same LDL-C but dramatically different ApoB—the one with more particles faces higher risk.
Lp(a) — Lipoprotein(a)
- What it measures: A genetically determined lipoprotein that promotes clotting and inflammation.
- Optimal range: Below 30 mg/dL (below 75 nmol/L).
- Why it matters: Elevated Lp(a) is an independent risk factor for heart attack, stroke, and aortic valve stenosis. Unlike other lipid markers, Lp(a) is almost entirely determined by genetics—diet and exercise barely move it. Approximately 20% of the population has elevated Lp(a) and most have never been tested. You only need to test once, but that one result may significantly change your cardiovascular risk management.
Triglycerides
- Optimal range: Below 100 mg/dL (ideally below 80).
- Why it matters: Elevated triglycerides are a hallmark of metabolic dysfunction and insulin resistance. The triglyceride-to-HDL ratio is a simple but powerful proxy for insulin resistance—a ratio above 2.0 warrants attention.
Inflammation
Chronic low-grade inflammation is one of the central mechanisms of aging, often called "inflammaging." These markers help you detect it before it causes damage.
hsCRP (High-Sensitivity C-Reactive Protein)
- What it measures: A liver protein that rises in response to systemic inflammation.
- Optimal range: Below 1.0 mg/L (ideally below 0.5 mg/L).
- Why it matters: The JUPITER trial demonstrated that people with elevated hsCRP had significantly higher cardiovascular event rates even when LDL cholesterol was normal. It's a general inflammation marker—elevated levels can reflect cardiovascular risk, autoimmune activity, gut inflammation, or chronic infection.
- Context: A single elevated reading should be retested after 2-4 weeks, as acute illness or injury can cause temporary spikes.
Homocysteine
- What it measures: An amino acid that, when elevated, is toxic to blood vessel walls and associated with neurodegeneration.
- Optimal range: Below 8 µmol/L.
- Why it matters: Elevated homocysteine is linked to cardiovascular disease, stroke, and cognitive decline. It's modifiable—B vitamins (folate, B12, B6) are the primary regulators. If your homocysteine is high, it's often a functional indicator of B vitamin insufficiency, even if your B12 levels appear normal.
Hormones
Hormonal status profoundly affects energy, body composition, mood, cognition, and aging rate. These markers decline with age, but the rate of decline varies enormously between individuals.
Testosterone (Free and Total)
- Optimal range (men): Total 500-900 ng/dL; free testosterone varies by age.
- Optimal range (women): Total 15-70 ng/dL.
- Why it matters: Population-level testosterone has declined approximately 1% per year since the 1980s, independent of aging. Low testosterone is associated with increased visceral fat, insulin resistance, depression, cognitive decline, and cardiovascular risk. For men, both free and total testosterone should be tested—SHBG (sex hormone-binding globulin) can make total levels misleading.
DHEA-S (Dehydroepiandrosterone Sulfate)
- What it measures: The most abundant circulating steroid hormone, produced by the adrenal glands. It's a precursor to both testosterone and estrogen.
- Optimal range: Age-dependent, but higher within range is generally better.
- Why it matters: DHEA-S declines steadily with age, dropping roughly 80% between ages 25 and 75. Low levels are associated with cardiovascular disease, depression, and all-cause mortality. Some longevity researchers consider it a biomarker of biological aging.
Thyroid Panel (TSH, Free T3, Free T4)
- Optimal range: TSH 0.5-2.5 mIU/L (not the standard 0.4-4.5 range); free T3 and free T4 in the upper third of the reference range.
- Why it matters: Subclinical hypothyroidism—where TSH is elevated but still "normal"—affects up to 10% of adults and is a common cause of fatigue, weight gain, brain fog, and depression. A TSH of 4.0 is "normal" by standard ranges but may indicate your thyroid is struggling. Testing free T3 and free T4 alongside TSH provides a complete picture.
Vitamins & Minerals
Nutrient status directly affects nearly every biomarker above. Deficiencies are common even in well-fed populations, and standard ranges are often set too low.
Vitamin D (25-Hydroxy Vitamin D)
- Optimal range: 40-60 ng/mL.
- Why it matters: Vitamin D is involved in immune function, bone health, mood regulation, and insulin sensitivity. Deficiency (below 30 ng/mL) affects an estimated 42% of US adults. The standard "normal" range starts at 30 ng/mL, but evidence from the Endocrine Society and longevity research suggests 40-60 ng/mL is the sweet spot for disease prevention. For supplement guidance, see our longevity supplement guide.
Vitamin B12
- Optimal range: 500-1,000 pg/mL.
- Why it matters: B12 is essential for nerve function, DNA synthesis, and red blood cell formation. The standard lower limit of 200 pg/mL is too low—neurological symptoms can appear at levels below 400 pg/mL. Plant-based eaters, older adults, and anyone on metformin are at particular risk of deficiency.
Ferritin
- Optimal range: Men 40-150 ng/mL; women 40-100 ng/mL.
- Why it matters: Ferritin reflects iron storage. Too low (below 30 ng/mL) causes fatigue, hair loss, and impaired exercise performance. Too high (above 200 ng/mL in men, 150 ng/mL in women) is pro-inflammatory and associated with increased cardiovascular risk, liver damage, and oxidative stress. Ferritin is also an acute-phase reactant, meaning it rises with inflammation—interpret in context with hsCRP.
Omega-3 Index
- Optimal range: Above 8%.
- Why it matters: The Omega-3 Index measures the percentage of EPA and DHA in red blood cell membranes, reflecting your omega-3 status over the past 3 months. An index below 4% is associated with a 10-fold higher risk of sudden cardiac death compared to above 8%. The average American index is around 4-5%—well below optimal.
Peter Attia's Recommended Panel
Dr. Peter Attia, one of the most influential voices in longevity medicine, has publicly shared the biomarker panel he runs on his patients. It goes significantly beyond standard blood work:
- Complete metabolic panel (glucose, insulin, HbA1c, HOMA-IR)
- Advanced lipids (ApoB, Lp(a), LDL-P, oxidized LDL)
- Inflammation (hsCRP, homocysteine, fibrinogen)
- Hormones (testosterone, DHEA-S, estradiol, SHBG, IGF-1, full thyroid)
- Nutrients (vitamin D, B12, folate, ferritin, RBC magnesium, omega-3 index)
- Liver and kidney function (comprehensive metabolic panel, GGT, uric acid, cystatin C)
- Complete blood count with differential
This panel costs $1,000-$2,000 if ordered piecemeal through traditional healthcare. Services like Function Health now offer comparable breadth for $499/year—a fraction of the cost. See our best at-home blood test comparison for details on how to access this level of testing.
Browse All Products
Explore our evidence-based product reviews across every health category.
How to Interpret Your Results in Context
Raw numbers without context are misleading. Here's how to interpret blood work like a longevity physician:
Look at trends, not snapshots. A single HbA1c of 5.5% might be fine. An HbA1c that's risen from 5.0% to 5.5% over two years is a clear trajectory toward metabolic dysfunction. Always compare results to your own historical data.
Consider the full picture. Biomarkers interact. An elevated fasting glucose combined with high triglycerides, low HDL, and elevated insulin tells a clear story of insulin resistance—even if each individual marker is still "normal." The pattern matters more than any single number.
Account for acute confounders. A hard workout 24 hours before testing can spike CRP and liver enzymes. A night of poor sleep elevates cortisol and glucose. Recent illness raises inflammatory markers. If a result seems off, retest under better conditions before drawing conclusions.
Use optimal ranges, not standard ranges. Standard reference ranges are the floor, not the ceiling. When your goal is longevity rather than disease avoidance, optimal ranges represent the levels associated with the lowest risk and highest function.
How Often Should You Test?
- Comprehensive panel: Every 6-12 months for most people. Quarterly if you're actively intervening (new medication, major diet change, supplement protocol).
- Lp(a): Once in your lifetime (genetically fixed).
- Vitamin D: Twice per year (summer and winter) until you've dialed in supplementation, then annually.
- Metabolic markers (glucose, insulin, HbA1c): Every 3-6 months if you're working on metabolic health. A CGM can supplement this with real-time data between blood draws.
- Hormones: Every 6-12 months, or more frequently if undergoing treatment.
Building a personal biomarker dashboard and tracking your data longitudinally is one of the most powerful things you can do for your health. It transforms blood work from a passive checkup into an active optimization tool—a core pillar of any serious longevity blueprint.
Get smarter about health tech
Deal alerts, new reviews, and health tips — delivered weekly. No spam.
Unsubscribe anytime. We respect your inbox.
Frequently Asked Questions
What blood tests should I ask my doctor for beyond the standard panel?
At minimum, ask for fasting insulin, HbA1c, hsCRP, ApoB, vitamin D, and a full thyroid panel (TSH, free T3, free T4). If your doctor won't order them, direct-to-consumer services like InsideTracker or Function Health can fill the gap. Lp(a) should be tested at least once in your lifetime.
What's the difference between "normal" and "optimal" blood test ranges?
Standard "normal" ranges represent the middle 95% of the tested population—which includes many unhealthy people. Optimal ranges reflect the levels associated with the lowest disease risk and highest function in long-term studies. For example, standard fasting glucose "normal" goes up to 99 mg/dL, but optimal is 72-85 mg/dL. The gap between normal and optimal is where preventive medicine lives.
Can I improve my biomarkers without medication?
Many biomarkers respond dramatically to lifestyle changes. Fasting insulin and triglycerides often normalize within weeks of dietary changes (reducing refined carbs, increasing fiber). HbA1c improves over 3 months with better glucose management. hsCRP drops with exercise, omega-3 supplementation, and sleep optimization. Some markers (ApoB, Lp(a)) may require medication in addition to lifestyle changes—discuss with your physician.
How much does comprehensive blood work cost out of pocket?
A truly comprehensive panel (50-100+ biomarkers) costs $200-$600 through direct-to-consumer services. The same markers ordered through traditional healthcare can run $1,000-$3,000 without insurance. Many at-home services accept HSA/FSA payments, effectively discounting the cost by 20-30%.
Should I fast before blood work?
Yes—fast for 12 hours before your draw (water and black coffee are fine). Fasting is essential for accurate glucose, insulin, and lipid measurements. Non-fasting draws can inflate triglycerides by 20-30% and make insulin meaningless.
How do I know if my blood work changes are meaningful or just normal variation?
Look for changes exceeding 10-15% from your personal baseline. A fasting glucose that moves from 85 to 88 mg/dL is noise. A move from 85 to 100 mg/dL is a signal. Context matters too—acute illness, medication changes, and menstrual cycle phase can all cause transient shifts. When in doubt, retest in 4-6 weeks to confirm the trend.
The Bottom Line
Your blood work is the most objective window into your health. But only if you're testing the right markers, interpreting them against the right ranges, and tracking them over time.
Don't settle for "normal." Aim for optimal. The biomarkers in this guide represent the core panel that longevity physicians use to detect dysfunction years before it becomes disease. Whether you test through your doctor or a direct-to-consumer service, the data is power—but only if you act on it.
Featured Products
Products mentioned in this article

Related Guides
More articles you might find helpful
Eli Health Hormometer FAQ: 30 Real Questions From Early Users (2026)
The Eli Health Hormometer is the first instant at-home cortisol monitor, and because it debuted at CES 2026 it's new enough that most people have the same handful of questions before they buy. We've pulled together the 30 we see asked most often — in health optimization communities, in our inbox, an
How to Improve HRV: The Evidence-Based Guide to Raising Heart Rate Variability
HRV (heart rate variability) is the metric that ties everything together in modern health optimization. It reflects autonomic nervous system balance — the equilibrium between your sympathetic (stress) and parasympathetic (recovery) systems. Higher HRV generally indicates better cardiovascular fitnes
Peptides for Beginners: What They Are, How They Work, and What You Need to Know
Peptides have entered mainstream health discourse — showing up on longevity podcasts, in clinic menus, and across biohacking forums. If you're new to the topic and trying to assess whether they're legitimate science or hype, this beginner's guide gives you the foundational framework to think about t

Written by
Steve Luu
Health tech researcher